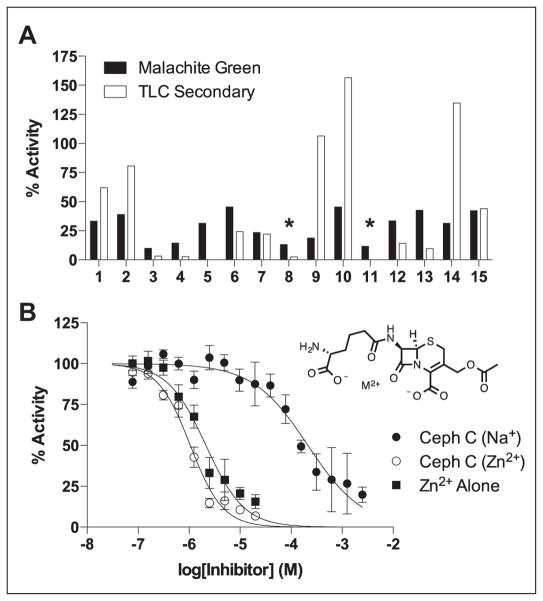
Figure 3.
Hit confirmation. (A) The 15 hits that showed inhibition greater than 6σ below the mean were tested using a previously described thin-layer chromatography–based activity assay that employs [3H8]dGTP as the substrate. The reaction conditions matched those of the high-throughput screen (HTS). In the secondary screen, only three compounds showed significantly less inhibition than in the direct hydrolysis assay. It is possible that these false-positives could have been inhibitors of the PPase coupling enzyme in the HTS. The asterisks indicate the reactions that contained cephalosporin C. (B) Dose-response curves for the two salt forms of cephalosporin C (structure shown). A dose-response curve was also obtained for Zn2+ alone (Cl− counter-ion). See the text for further discussion of the inhibition by these cephalosporins.

