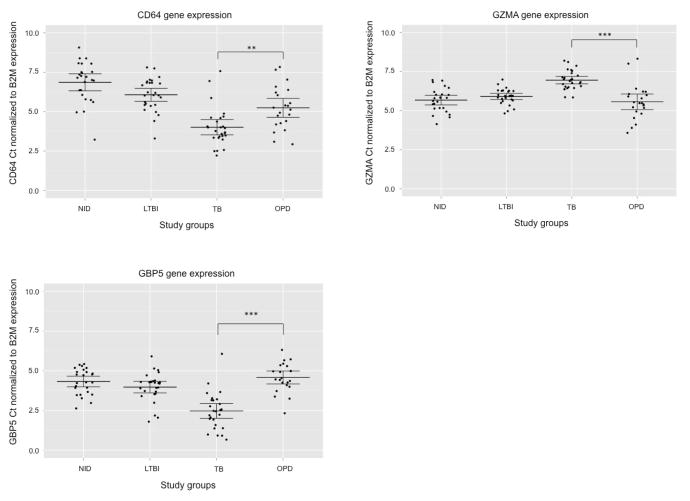
Figure 1.
Differences in gene expression levels between NIDs, LTBI, TB and OPD donors. Scatter dot plots for CD64, GZMA and GBP5 represent the gene expression for each individual donor. Ct values from real-time PCR were normalized to the internal reference gene B2M. The mean and 95% confidence interval are indicated. ** indicates a p-value < 0.01; *** indicates a p-value < 0.001. NID, healthy non-infected donors; LTBI, healthy donors latently infected with M. tuberculosis; TB, tuberculosis patients; OPD, patients with other pulmonary disease than TB (asthma and pneumonia).

