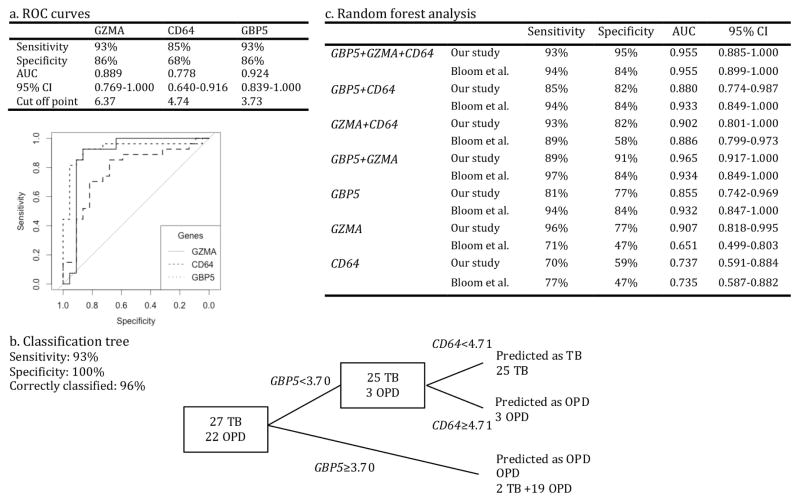
Figure 2.
Analyses performed to evaluate the discriminatory ability of GBP5, GZMA and CD64 genes and find the optimal gene combination to discriminate between TB and OPD groups. a, ROC analysis identified GBP5 as the strongest discriminatory gene. b, Classification tree is shown based on the gene expression of GBP5 and CD64. The “tree” software did not include GZMA. The sensitivity and specificity of the two-gene panel was 93% and 100%, respectively, and 96% individuals were correctly classified as TB or OPD. c, Sensitivity and specificity values obtained from random forest analysis of GBP5, GZMA and CD64 combinations applied to our study and Bloom’s (Bloom et al., 2013) data. AUC values (with 95% confidence interval) obtained by running ROC analysis on random forest votes are also given. AUC, area under curve; CI, confidence interval; OPD, patients with other inflammatory pulmonary diseases (asthma and pneumonia); ROC, receiver operating characteristic; TB, tuberculosis patients.

