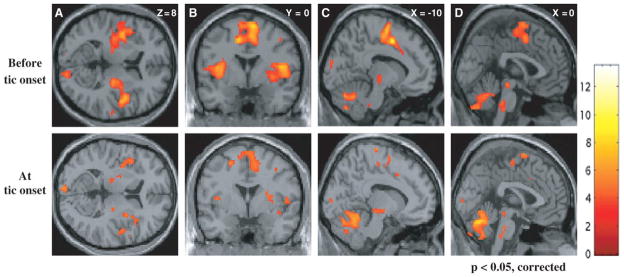
Figure 1.

Event related functional MRI of tics. Statistical parametric maps superimposed on axial (A), coronal (B) and sagittal (C and D) views are shown. The upper row shows significant activations (P < 0.05, corrected for multiple comparisons) of paralimbic areas (ACC and insular region bilaterally) before tic onset; these activations were much less prominent at tic onset (lower row). From Bohlhalter S, Goldfine A, Matteson S et al. Neural correlates of tic generation in Tourette syndrome: an event-related functional MRI study. Brain 2006;129:2029–2037, with permission.
