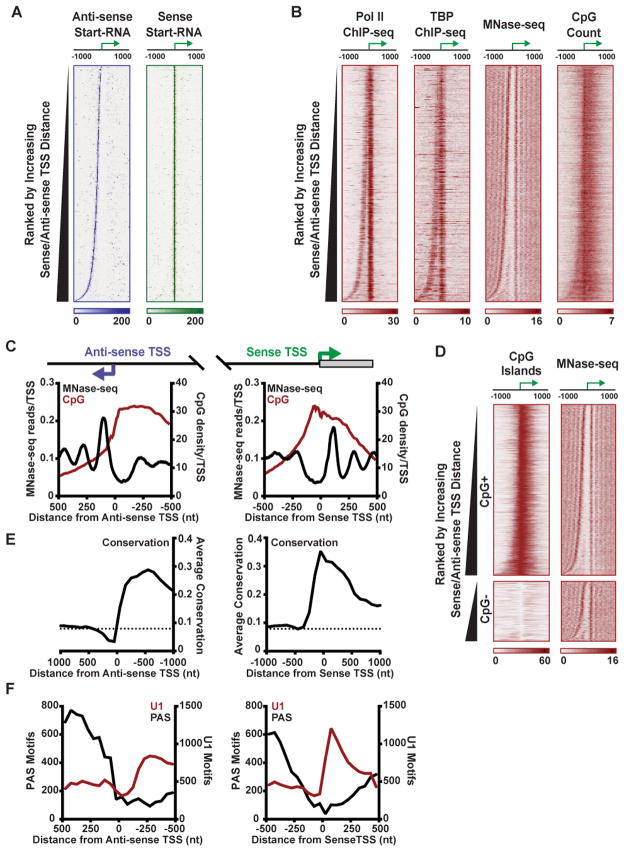
Figure 3. Transcription Machinery and Nucleosomes Are Highly Organized around Both Sense and Anti-sense TSSs.
(A) Start-RNA reads obtained from macrophages are shown in the anti-sense (purple) and sense (green) direction, both aligned with respect to sense TSSs. Genes are rank ordered by the distance between the sense and anti-sense TSSs. Data shown throughout this figure are for 8,730 Pol II-bound promoters with sufficient Start-seq reads for identification of sense and anti-sense TSSs in resting macrophages.
(B) Pol II and TBP ChIP-seq, MNase-seq and CpG dinucleotide count are shown, centered on sense TSSs, with genes rank ordered as in (A).
(C) Average distribution of nucleosomes (from MNase-seq, black) and CpG dinucleotide count (red) centered on either the anti-sense (left) or sense (right) TSSs.
(D) CpG island distribution and MNase-seq are shown for bidirectional genes categorized as CpG+ (N=6,464) or CpG− (N=2,266), ranked by increasing distance between sense and anti-sense TSSs.
(E) Conservation score across placental mammals (phyloP) is shown in 2 kb windows centered on anti-sense or sense TSSs as shown in (C). Dashed line indicates average conservation score across the mouse genome.
(F) Number of poly-A sequences (PAS; black) or motifs recognized by U1 snRNP (U1; red) in 50-mer bins centered upon either the anti-sense TSS (left) or sense TSS (right).
See also Figure S3.

