
Figure 1. Oxidative stress and OGD-induced changes in phosphocofilin and cofilin expression.
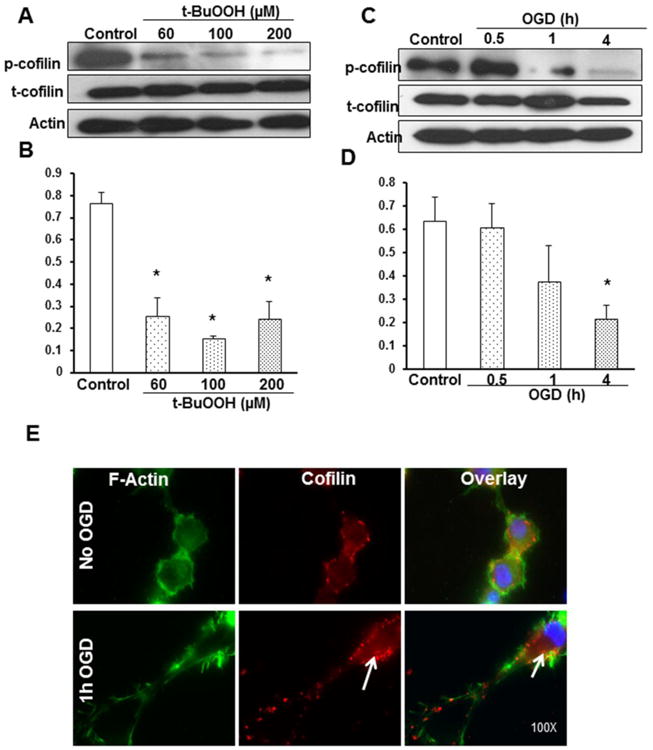
A PC12 cells were subjected to treatment with 60, 100 and 200μM concentrations of t-BuOOH for 1 h, and the protein expression levels were evaluated. Representative blot shows phosphocofilin expression, which was found to be significantly decreased with increasing concentration of t-BuOOH. C. Representative blot shows phosphocofilin, total cofilin and actin expression pattern at 30 min, 1 and 4 h of OGD using differentiated PC12 neuronal cells. Time course study demonstrated the dephosphorylation of phosphocofilin occurring with increasing periods of stress. The decline in the phosphorylated form initiated within 1 h of OGD, followed by a complete decline within 4 h of OGD. B and D. Graphs represent the densitometric analysis values normalized with actin and the ratio of phosphocofilin to total cofilin levels plotted against treatment groups. E. Representative immunofluorescence pictures show that cofilin (stained red) is co-localized with the F-actin filaments, predominantly in the cell periphery and cytoplasm of differentiated PC12 neuronal cells. After OGD, most of the actin filaments were rigid and degraded. The areas with white arrows show cofilin prevalence in aggregated actin filaments. Scale bar is 10 μm. Experiments were performed thrice with separate batches of cells, and the graphs are the cumulative results of three different experiments. Data are expressed as mean±SEM, where p<0.05 was considered significant. *vs control