
Figure 4. Cofilin expression levels in the cytosolic and nuclear fractions after OGD and OGD/R.
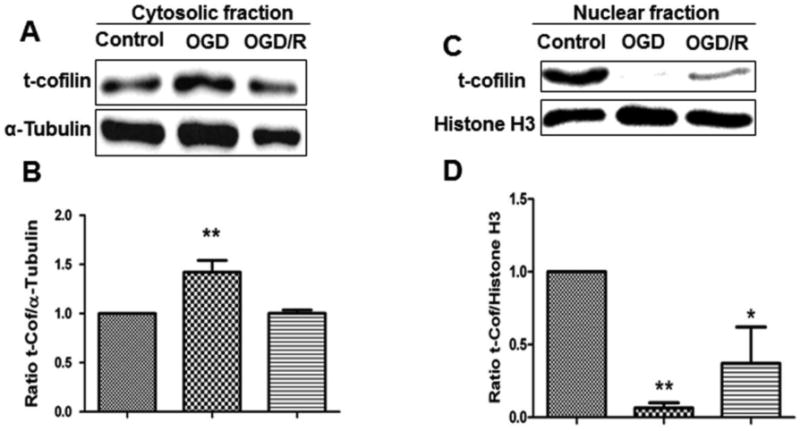
One set of mouse primary cultures of cortical neurons was subjected to 1 h of OGD and the other to 1 h of OGD and 24 h of reperfusion. Cytosolic and nuclear fractions of neurons were analyzed to check for cofilin expression levels by comparing them to control neurons (no OGD or OGD/R). A and C. Representative blots show increased cofilin expression after 1 h of OGD in the cytosolic fraction and decreased in the nuclear fraction. During the 24 h of reperfusion period, cofilin goes back gradually to normal levels in both fractions. B and D. Graphs represent the densitometric analysis of cofilin normalized with α-tubulin in the cytosolic fractions and Histone H3 in the nuclear fractions as loading control. Data are represented as mean±SEM of three independent experiments where p<0.05 was considered significant. *vs control.