
Figure 5. Cofilin expression levels in cofilin knock-down primary cultures of cortical neurons.
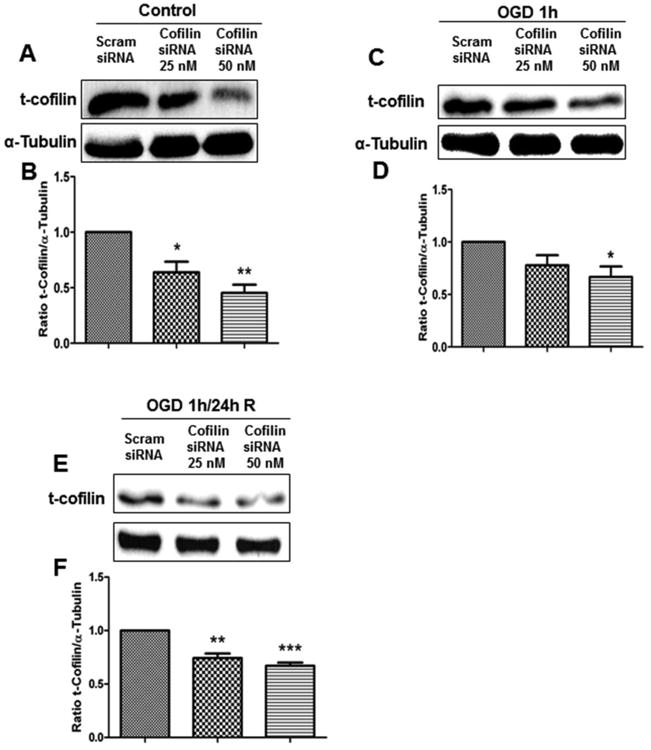
Mouse primary cultures of cortical neurons at DIV 4 were transfected with cofilin1 siRNA (25 and 50 nM) for 72 h and then harvested for Western blot analysis (control). OGD-treated primary cultures of cortical neurons were subjected to 1 h of OGD 72 h posttransfection and then harvested for immunoblotting (OGD). OGD/R-treated primary cultures of cortical neurons were subjected to 48 h transfection, followed by 1 h of OGD and 24 h of reperfusion, and were harvested for immunoblotting (OGD/R). A, C and E. Representative blots show a decrease in cofilin expression levels in cofilin knock-down in all treatment paradigms (control, OGD and OGD/R). B, D and F. Graphs represent densitometric analysis of cofilin normalized to α-tubulin as a loading control. Data are expressed as mean±SEM of three independent experiments, where p<0.05 was considered significant. *vs control (scrambled siRNA).