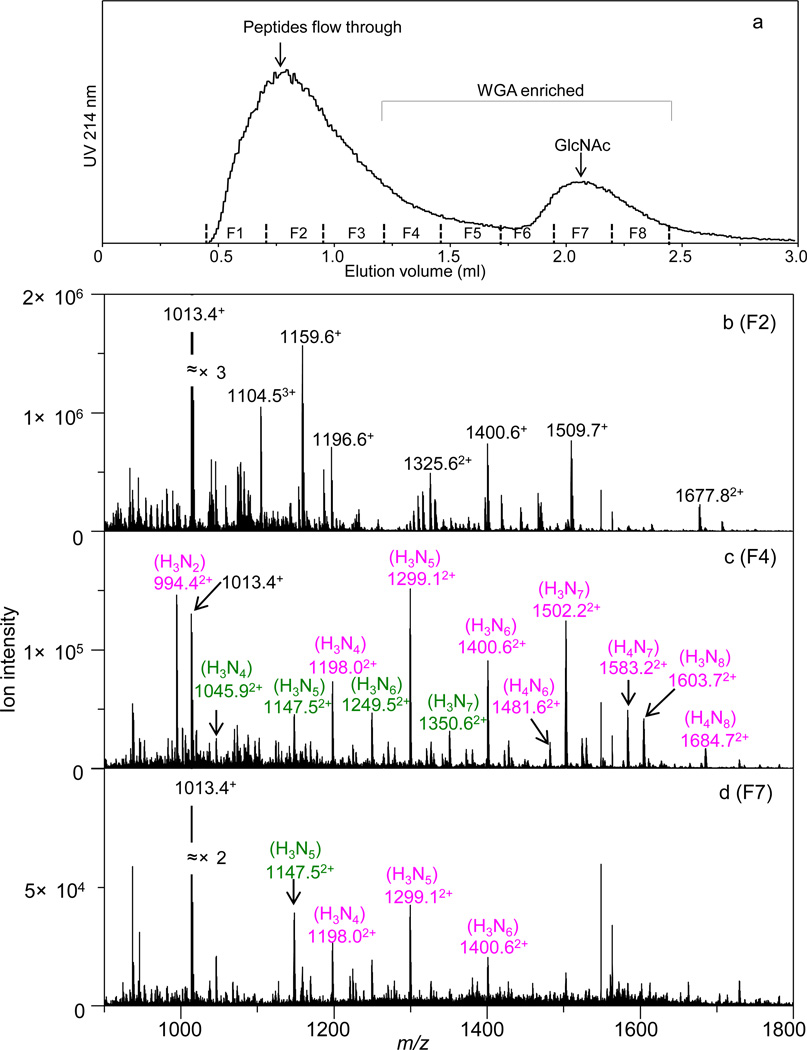
Figure 1.
(a) UV absorption trace at 214 nm of the lectin affinity chromatography (LAC) enrichment of the ovomucoid digest using an isocratic buffer condition. Vertical lines immediately above the X axis indicate positions of the fractions collected (F1–F8). The orbitrap MS analysis of species in fractions F2, F4, and F7 are displayed in panels b, c, and d, respectively. Each spectrum was obtained by integrating the elution window corresponding to all peptides. Glycopeptides are labeled in color (pink: SIEFGTN*ISK; green: FPN*ATDK. The * symbol indicates the glycosylation site), and the associated glycan forms are shown in the parentheses above the m/z labels. Non-glycosylated peptides are indicated by black m/z labels. Charge state of each ion is labeled in superscript to the m/z label.

