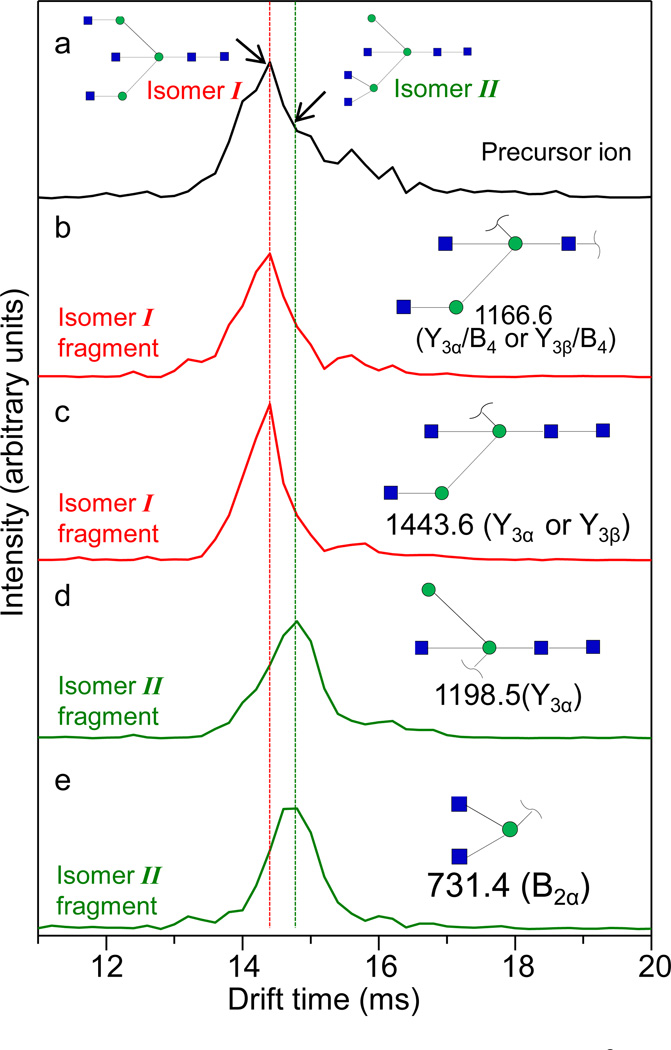
Figure 6.
(a) IMS distribution of the precursor glycan ion [H3N5+2Na]2+ (m/z = 964.8). Two isomeric structures, isomer I and isomer II, are shown in cartoon representations as described in Figure 4. CID spectra of this precursor ion are taken across entire the drift time range. The extracted fragment ion drift time distributions (XFIDTD) of the unique fragments to isomer I (red traces) and isomer II (green traces) are shown in panels b–e. Fragments at m/z = 1166.6 and 1443.6 are unique to isomer I. Fragments at m/z = 1198.5 and 731.4 are unique to isomer II. The fragments are singly-sodiated. The dashed lines are drawn to guide the eye.

