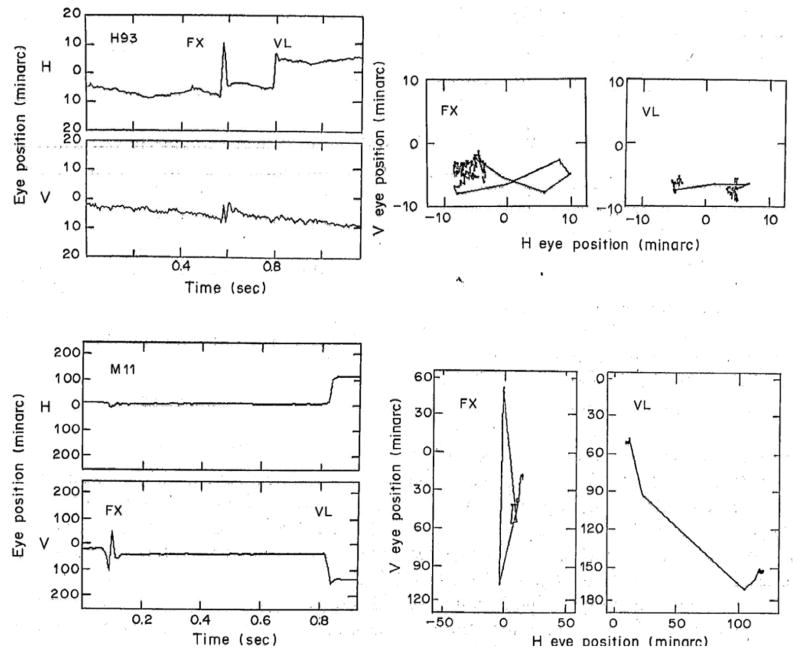
Figure 1.
Comparison of fixational and voluntary saccades. Upper panels left, position vs time plots of a fixational saccade cluster, FX, of human subject H93, along with a voluntary saccade, VL, elicited by abruptly stepping the fixation target to the right. Upper panels right. Shorter segments of the same fixation trial plotted two dimensionally to show the spatial trajectories of the saccades. For FX the trial segment from 0 to 0.7 sec was plotted and for VL, the time period was 0.7–1.1 sec. The lower panels give a similar display of fixational and voluntary saccades for monkey M11. For both FX and VL a trial segment of 0.5 sec including the saccade cluster is plotted two-dimensionally in the lower right panels. The zero position is the mean of eye position in the last half-second in all trials of the sessions in which these trials were recorded. Recordings made with a dual Purkinje image eyetracker. From Snodderly (1987).

