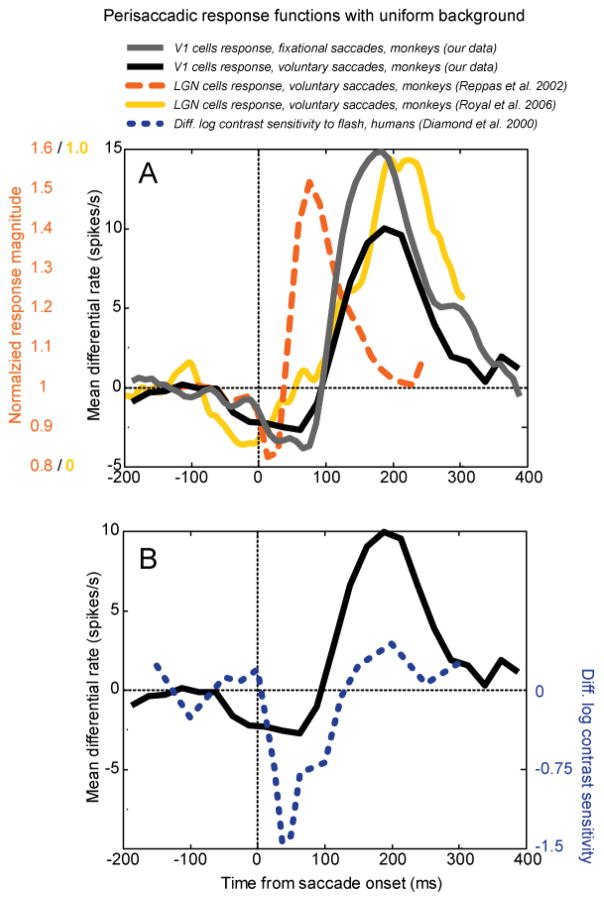
Figure 13.
Comparison of extraretinal perisaccadic modulation at different levels of visual processing. Saccade onset-triggered averages with a uniform lighted background in each case. (A) Modulation of neuronal firing by saccades in the presence of a blank field. Gray curve, V1 cells, our data, differential firing rate associated with fixational saccades, mean values from 2 monkeys. Black curve, differential firing rate associated with voluntary saccades. Dashed orange line, monkey LGN normalized firing rate (data from Reppas et al. 2002). Solid yellow line, monkey LGN normalized firing rate (data extracted from Figure 9A of Royal et al. 2006 using WinDig software). All neuronal data are for cells showing significant modulation. (B) Comparison of our monkey V1 data with extraretinal modulation of human perceptual thresholds. Black curve, V1 extraretinal modulation associated with voluntary saccades copied from A. Dashed blue line, human psychophysical data: differences between log contrast sensitivity at times relative to a real saccade and relative to simulated saccadic motion for a flashed grating (2 human subjects averaged, data from Diamond et al. 2000). The human data have been shifted rightward by 50 ms to account for visual processing delay. (From Kagan et al., 2008).

