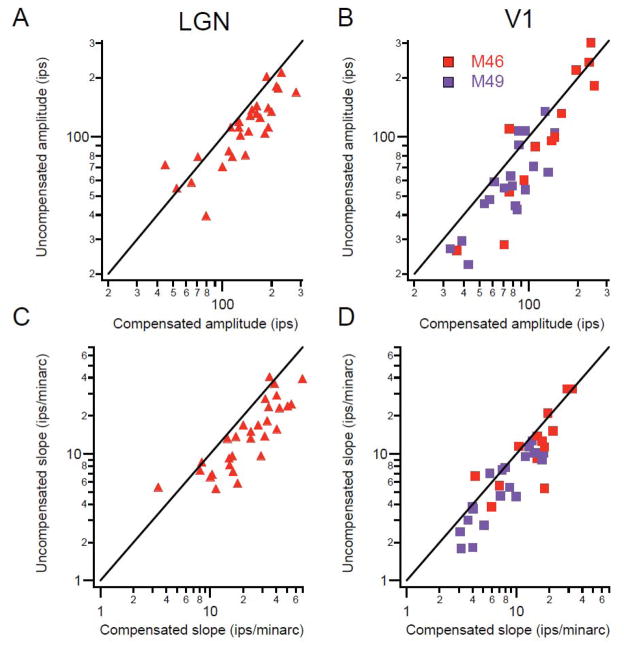
Figure 3.
A, B: Population comparisons for the maximum response amplitude in uncompensated vs. compensated conditions. Solid line is the line of equality. C, D: Uncompensated vs. compensated maximum slopes of the receptive field profiles. Other conventions same as Fig. 2. (From Tang et al., 2007).

