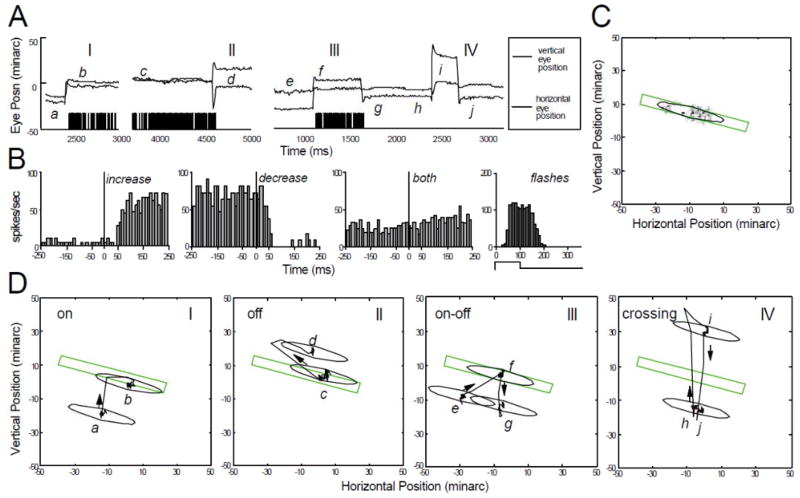
Figure 5.
Characteristics of a position/drift cell. (A) Activation of the cell by a green incremental stationary bar 6 min wide of optimal orientation, placed at the mean receptive field position. Four separate time segments (I–IV) from different trials are shown. (B) Saccade-triggered histograms of average spike frequency. Separate histograms are presented for saccades followed by increased activity (increase, n=18), saccades followed by decreased activity (decrease, n=12), and all saccades combined (both, n=30). Saccades occurred at t=0. Also shown is the average response histogram of the cell to flashing the bar (n=25, stimulus on 100 ms, off 250 ms for each repetition; temporal profile indicated under time axis). (C) Gray-scale map of CRF in eye position coordinates, along with elliptical outline used in subsequent panels. Stimulus bar used to generate the map is drawn to the same spatial scale. Minor axis of ellipse is width of cell’s CRF measured with a stabilized bar sweeping across its receptive field. (D) Spatial interactions between stimulus and CRF during the trial segments in panel A. The eye position data shown as a function of time in panel A are plotted here in space, along with the stimulus bar that evoked the activity. I—Saccade brings the CRF onto the stimulus. II—Saccade takes CRF off the stimulus. III—CRF moves onto the stimulus (first saccade), stays on the stimulus briefly, and then moves off it (second saccade). IV—Pair of saccades sweeping CRF rapidly (50 deg/s) across the stimulus and back. (From Snodderly et al., 2001).

