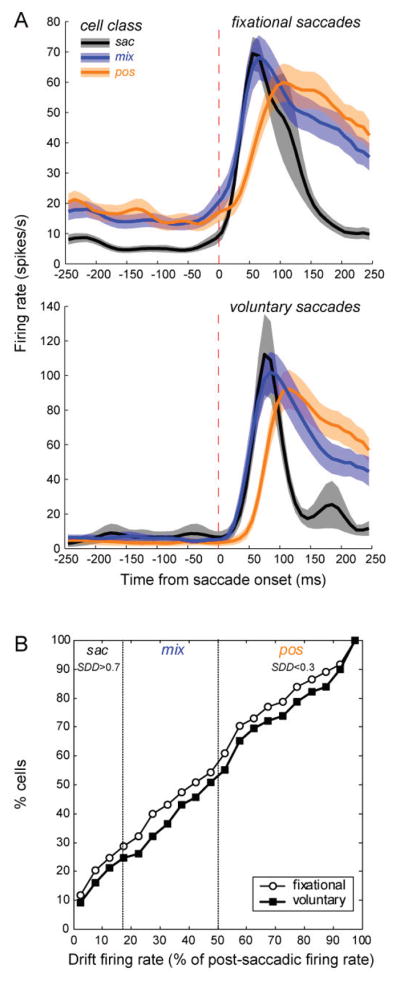
Figure 9.

(A) Population perisaccadic averages triggered by fixational increasing saccades for 118 cells (30 sac, 43 mix, 45 pos) and voluntary landing saccades for 44 cells (10 sac, 17 mix, 17 pos). Cells were assigned to eye movement activation classes according to the saccade-drift difference SDD as described in the text. Dashed vertical lines denote saccade onset. (B) Cumulative distribution of V1 cells as a function of the firing rate in the drift period relative to the firing rate in the post-saccadic burst period for fixational increasing saccades (open circles) and voluntary landing saccades (filled squares). Vertical dotted lines mark the borders between cell classes based on the SDD index. (From Kagan et al., 2008).
