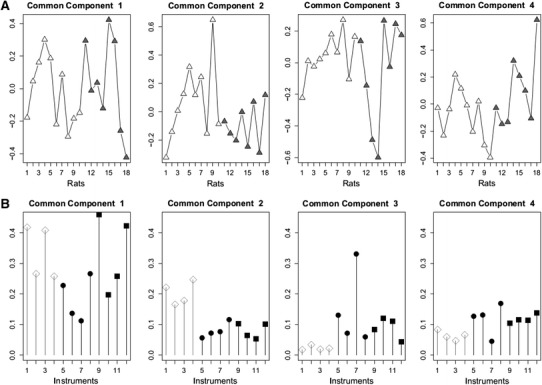
Fig. 2.

Individual common component and specific weights analysis scores (a) and saliences or loadings (b) calculated from the Test #2 datasets. No common dimension discriminated the groups, although common component #2 showed a trend towards group discrimination. More than 50 % of the total variability of the NMR instruments and of 2 LCMS instruments (Q2P and Q6P) was recovered in the first two common dimensions. The variability of all other LCMS instruments was mainly in the third and the fourth common components. The structure of the samples associated with the second common component is essentially due to the NMR instruments
