Fig. 2.
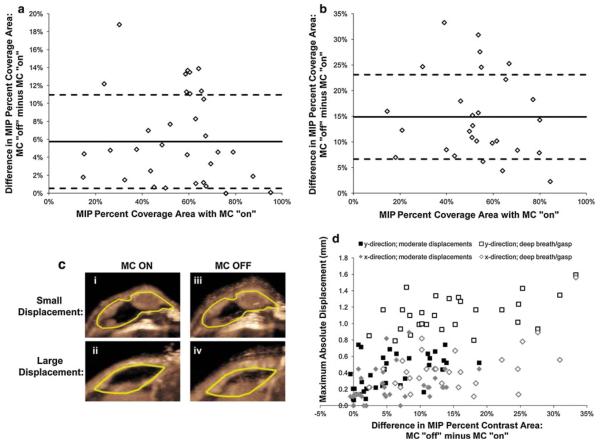
Differences in MIP percent coverage area between vascular measurements with and without motion compensation (y-axis: subtraction of motion compensation (MC) OFF minus MC ON) for individual animals with varying vascularity levels (x-axis: motion-compensated MIP percent coverage area); a summary of data in animals with moderate breathing artifacts; b summary of animals where a deep breath or gasp occurred. Solid lines represent the average value and dashed lines are the standard deviation for all individuals on each plot. c Representative transverse US images of two human colon cancer xenografts (yellow line, ROI) show intra-animal comparisons of MIP percent contrast areas measured with (MC ON; i and ii) and without (MC OFF; iii and iv) motion compensation (MC) in an animal with moderate breathing artifacts (small displacement) and in an animal where a deep breath/gasp occurred (large displacement). Note that varying levels of motion-induced blurring artifacts occur without motion compensation (MC OFF) compared with motion compensation (MC ON), especially when larger motion was a result of a deep breath (large displacement). d Individual displacements in both x- and y-directions significantly correlated well (P < 0.001) with differences measured between motion compensated and non-compensated MIP signal (Difference = MC OFF minus MC ON). (Color figure online)

