
Fig. 3.
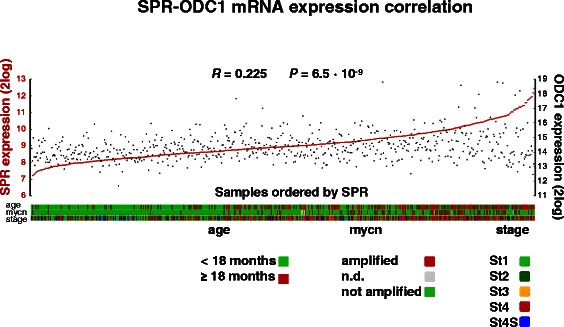
SPR expression correlation with ODC expression in NB. SPR and ODC mRNA expression correlation in the Kocak-649 NB cohort: visual representation of SPR and ODC expression in all 649 NB tumor samples, ranked horizontally from left to right according to their SPR expression. SPR and ODC (2log) expression values for each sample are visualized with red circles and black rectangles, respectively. The correlation between SPR and ODC expression is r = 0.225, with a P value of 6.5 · 10−9 (2log Pearson). Symbols representing the clinical values of the tumor samples: age at diagnosis, MYCN amplification, and INSS stage, are listed below the graph, together with their legend