
Fig. 6.
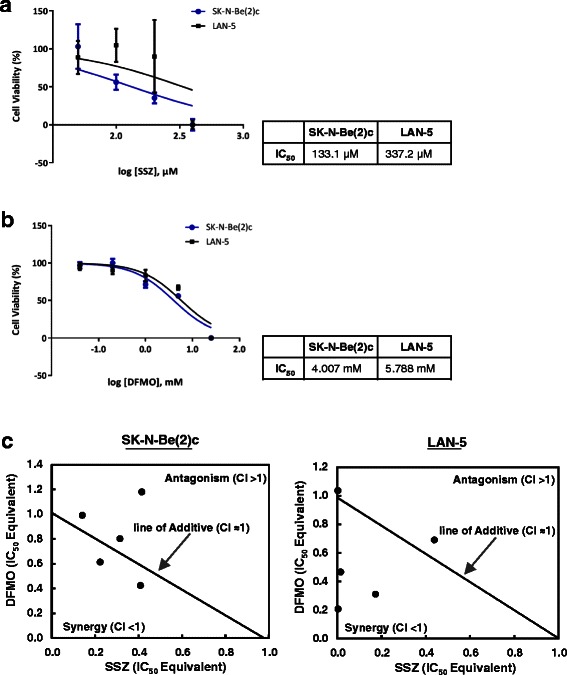
Isobologram analysis for SSZ and DFMO in NB. Isobolograms were prepared to determine synergisms between SSZ and DFMO. NB cell lines SK-N-Be(2)c and LAN-5 were used to determine the inhibitory concentration at which 50 % of cells are dead (IC50) after 48 h of treatment with (a) SSZ and (b) DFMO. (c) Isobologram analysis to determine the combined cytotoxicity of SSZ and DFMO using the IC50 values from (a and b). The IC50 value of SSZ and DFMO used in combination provides the connective points for the line of additive. Synergy, additivity, or antagonism is indicated below, on, or above the line, respectively. The data present the average of three independent experiments in duplicate (n = 6); points, mean ± SEM