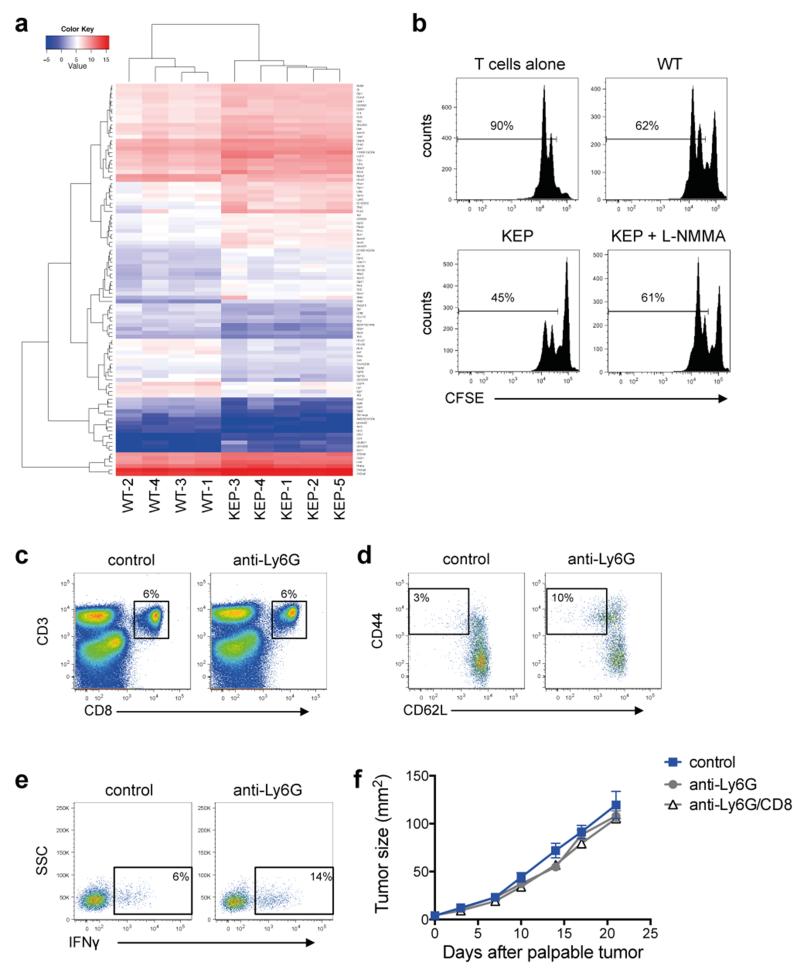
Extended Data Figure 4. Neutrophils influence the function and phenotype of CD8+ T cells.
a, Unsupervised hierarchical clustering of RNA-Seq analysis depicting 100 differentially expressed genes between circulating neutrophils from WT and tumor-bearing KEP mice. P value (0.05) was used as cutoff (n = 4 WT, 5 KEP mice). See also Extended Data Table 1 for top 50 genes ranked by fold change. b, Circulating neutrophils from either WT or tumor-bearing KEP mice were incubated with CFSE-labeled splenic CD8+ T cells from WT mice and CD3/CD28 stimulation beads. The iNOS inhibitor, L-NMMA, was added where indicated. After 48 hours, CD8+ T cell proliferation was measured by flow cytometry. c, Dot plots depicting live cell-gated CD8+ T cell proportions in lungs of mice in control and neutrophil-depleted mice, sacrificed when transplanted tumors reached 100 mm2. d, Dot plots of effector CD8+ T cell (CD62L−CD44+) proportions in lungs of transplanted mammary tumor-bearing mice that were sacrificed when tumors reached 100 mm2. e, IFNγ expression by CD8+ T cells in lungs of transplanted mammary tumor-bearing mice that were sacrificed when tumors reached 100 mm2. f, Tumor growth kinetics in neutrophil-depleted or combined neutrophil- and CD8+ T cell-depleted, mammary tumor-transplanted recipient mice, as compared with control (n = 13 control, 21 anti-Ly6G, 14 anti-Ly6G/CD8). Data are mean + s.e.m.

