
Figure 2.
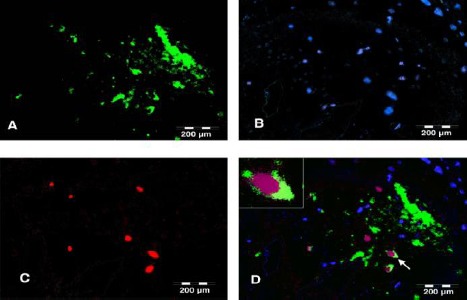
In vivo differentiation of BMS cells into cholinergic neurons; fluorescent staining for BrdU (red), ChAT (green) and nuclei (DAPI – blue) in a CA1 section of hippocampus. (A) green fluorescence represents ChAT+ cholinergic neurons, (B) DAPI staining of cell nuclei, (C) BrdU+ cells representing BMS cells migrated into the brain and (D) Merged image of the double staining for ChAT, nuclei and BrdU confirming differentiation of some BMS cells into cholinergic neurons (white arrow). The cell indicated by white arrow is shown with higher magnification in the inset. The purple color of the nucleus is the result of blue and red merger. All the scale bars are 200 μm