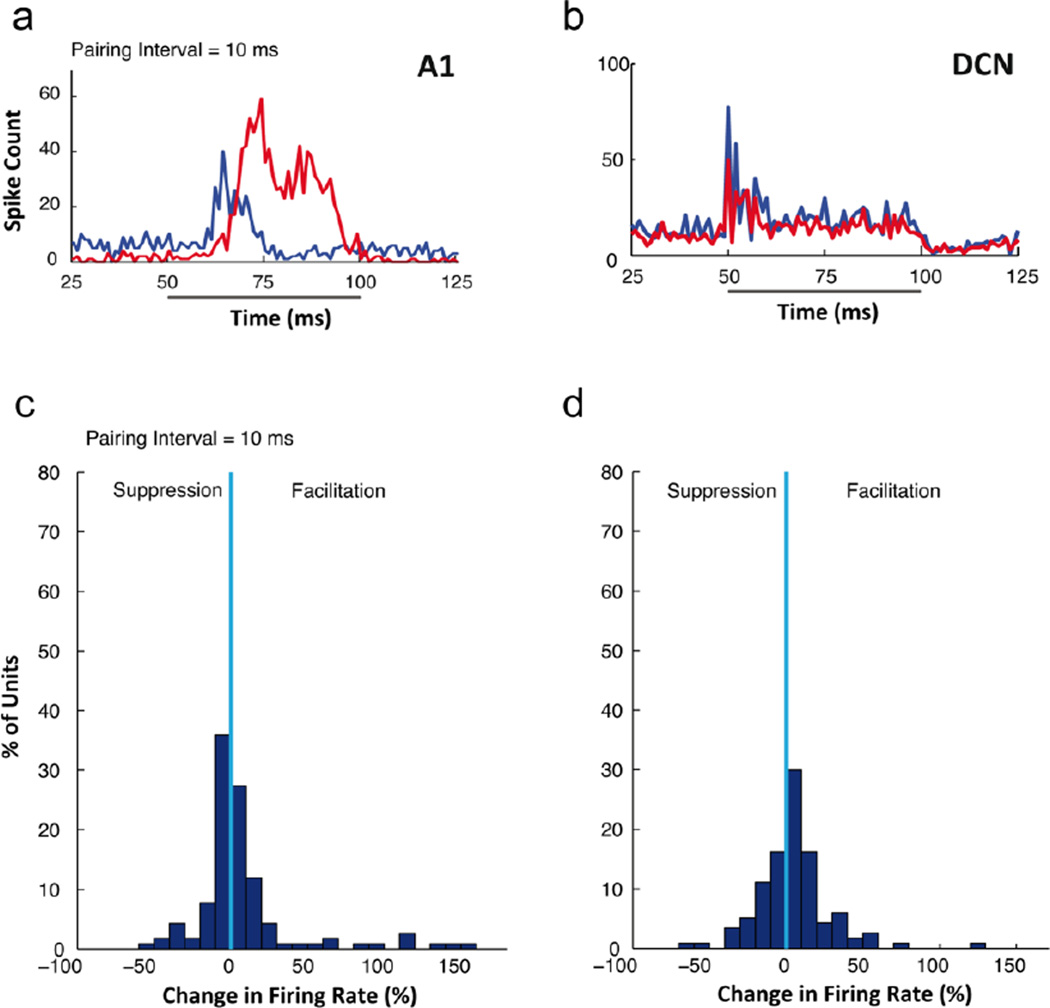
Fig 7. Bimodal stimulation results in persistent changes in A1 (A,C) and DCN (B,D).
Upper panels (A and B) show peri-stimulus time histograms (PSTHs) demonstrating the persistent 25 enhancement (A) and suppression (B) of somatosensory-auditory stimulation. Pre-bimodal responses to sound alone are shown in blue; post-pairing responses to sound alone are shown in red. Pairing interval: 10 ms. Black bar under PSTHs indicates tone duration. Histograms for A1 (C) and DCN (D) demonstrate the percentage of units showing persistent changes in firing rates following bimodal stimulation at a pairing interval of 10 ms. Responses to the right of zero are facilitated, while those left of zero are suppressed. Figure adapted from (Basura, et al., 2012).

