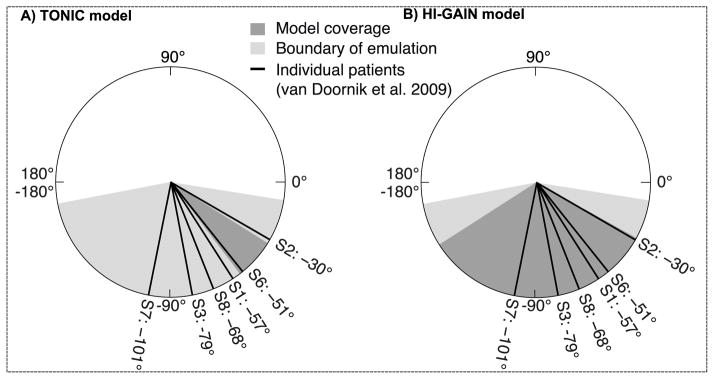
Figure 5.

The phase angle calculated from emulation and human data. The thick lines show the phase angles of 6 patients with hypertonic arm dystonia. (A) The TONIC model produces phase angles from −32° to −53° (dark gray area), which includes 1 out of 6 patients. (B) The HI-GAIN model produces phase angles from −29° to −147° (dark gray area), which includes all 6 patients. The boundary of emulation is tested by de-afferenting either the primary (group Ia) or the secondary (group II) spindle fiber, resulting in the minimum phase angle of −169° and the maximum of −9° (light gray area).
