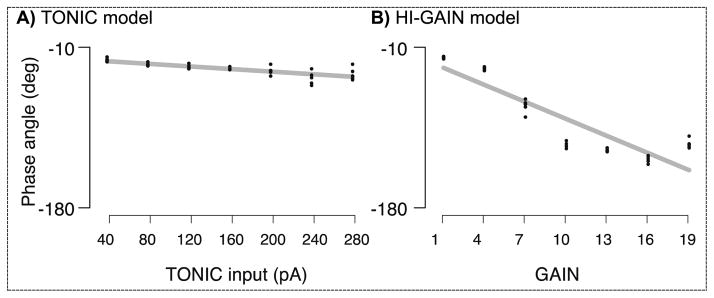
Figure 6.

The sensitivity of phase angle to the intensity of emulated dystonia in each model. In the TONIC model, we scan the TONIC input from 40pA to 280pA with fixed increments. The average phase angles produced by these TONIC inputs range from −32° to −53°, where a higher TONIC input significantly reduces the phase angle (slope = −0.074, p < 0.0001, r2 = 0.59, 4 repetition for each level of TONIC input). The linear trend tends to saturate when the TONIC input exceeds 240pA. In the HI-GAIN model, we start the scan of cortical gain by selecting a unit gain that amplifies the non-impaired EPSC by 4 times. The gain is increased to 19 times of a unit with fixed increments. The average phase angles produced by the HI-GAIN model range from −29° to −147°, where a higher cortical gain significantly reduces the phase angle (slope = −6.50, p < 0.0001, r2 = 0.78, 4 repetitions for each level of HI-GAIN). The linear trend tends to saturate when the TONIC input exceeds 16 units. These results suggest that in terms of phase angle, the HI-GAIN model can explain more human data than the TONIC model.
