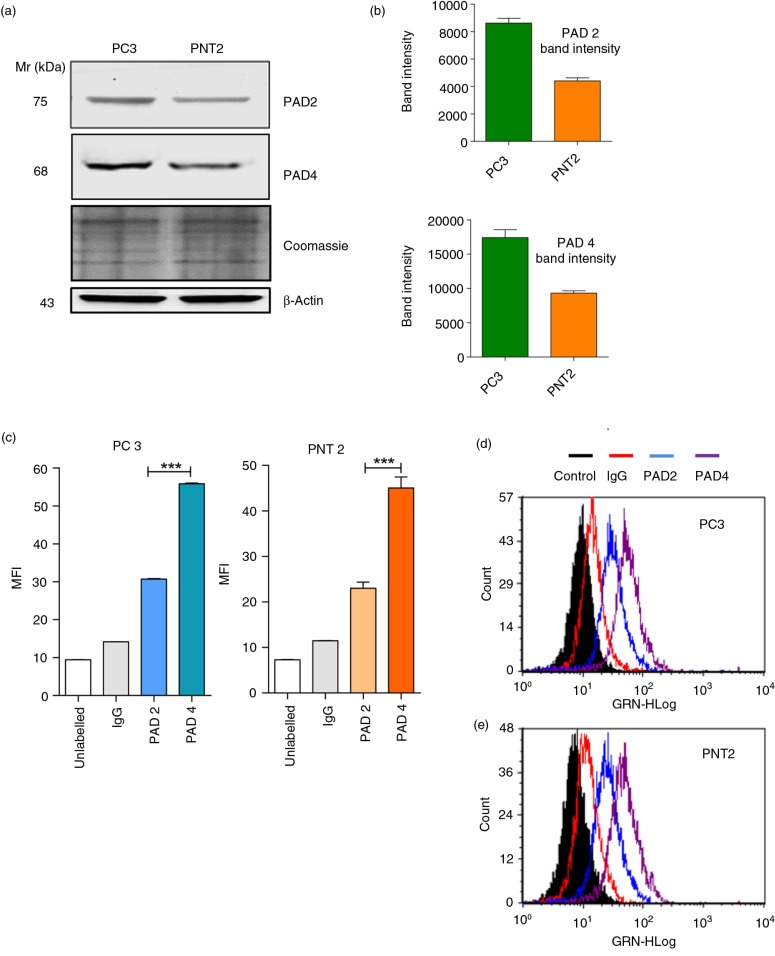
Fig. 1.
Immunoblotting and flow cytometry reveal higher detected PAD4 than PAD2 in PC3 and PNT2 cells and higher PAD2/4 expression in PC3 than PNT2 cells. (a and b) Western blot analysis and associated densitometry analysis (using Image J software) representing band intensity of healthy PC3 and PNT2 controls indicate higher detected PAD4 than PAD2 and of PAD2 and PAD4 in prostate cancer cells (PC3) compared to benign prostate cells (PNT2). Loading control: β-actin and Coomassie-stained SDS–PAGE. PC3 (c and d) and control PNT2 (c and e) cells were fixed, permeabilised and labelled with anti-PAD2 and anti-PAD4 antibody followed by FITC-IgG secondary antibody and analysed for PAD expression via flow cytometry. (c) Median fluorescence intensity (MFI) is a indicative of expression levels of PAD/cell. Significant differences were seen between PAD2 and PAD4 expression in both cell lines. Histograms in (d) represent% positive PC3/PNT2 cells for PAD2 and PAD4. Data represent the mean±SEM of 2 independent experiments performed in triplicate. *P<0.05, **P<0.001.

