Fig. 3.
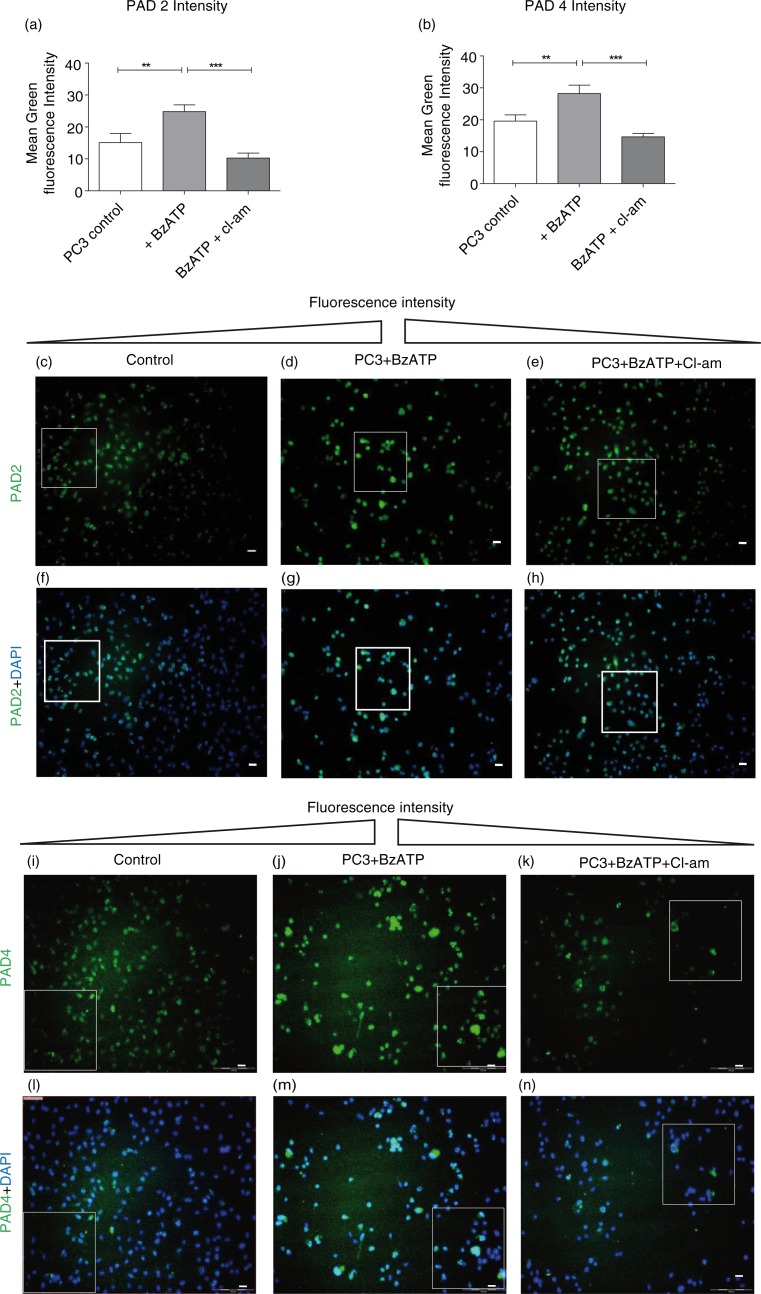
Increased expression of PAD2 and PAD4 upon microvesiculation is inhibited by chloramidine. Mean green fluorescence intensity [for PAD2 (a) and PAD4 (b)], as determined using Cell∧M imaging software on fluorescent microscopy images [panels (c–e) and (i–k)], respectively, indicates increased expression of PAD2 and 4 during BzATP stimulation of MV release. These values were obtained from PC3 cells preseeded on coverslips and pretreated with 10 µM Cl-am (e, h, k, n) or without Cl-am (d, g, j, m) for 30 min at 37°C. The cells were then washed and incubated at 37°C for 30 min in the presence (d, e, g, h and j, k, m, n) or absence (c, f, i, l) of 300 µM BzATP. (d, g, j, m) PAD2 and PAD4 (green) expression in PC3 cells are increased in response to stimulation of MV release (BzATP treatment) and reduced upon Cl-am treatment (e, h, k, n). (f–h) and (l–n) represent merged images of (c–e) and (i–k) respectively with nuclear (DAPI) staining. Scale bars – 100 µm, white bar, 20 µm.

