
Figure 1.
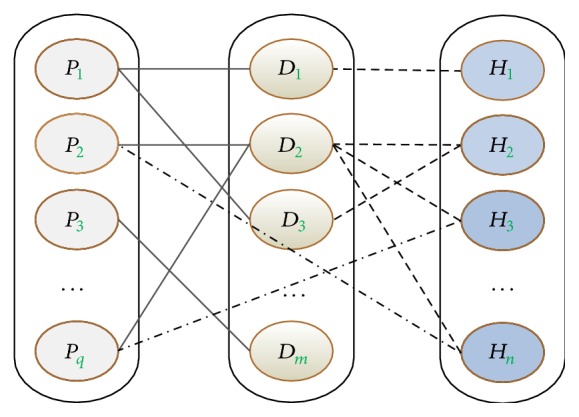
Tripartite graph structure of TCM. Here, instances of different objects are represented by different colour nodes and links among different objects are represented by different line styles. q, m, and n represent the number of symptom, the number of syndrome, and the number of herb, respectively.