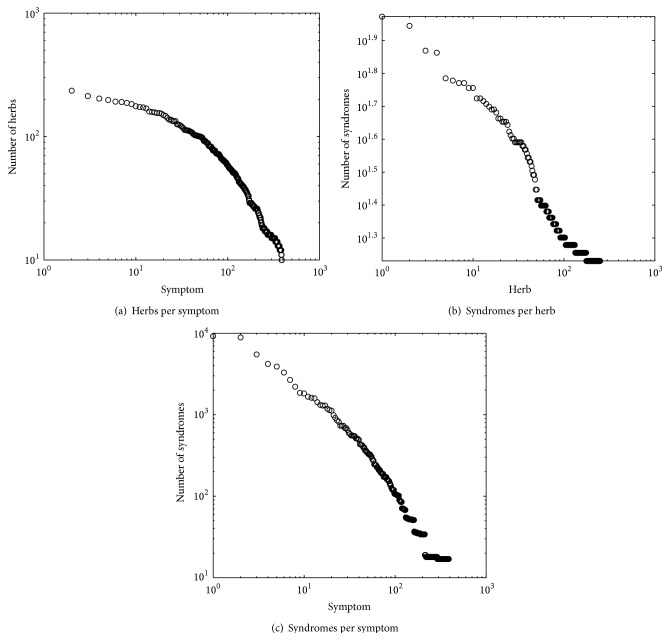
Figure 4.
Distribution of relationship of objects in Infertility Dataset. Here, in (a), the x-axis represents the 389 unique symptoms, ordered by the descending number of herbs per symptom. The y-axis refers to the number of herbs per symptom. In (b), the x-axis represents 251 unique herbs, ordered by descending number of syndromes per herb. The y-axis refers to the number of syndromes per herb. In (c), the x-axis represents the 389 unique symptoms, ordered by the descending number of syndromes per symptom. The y-axis refers to the number of syndromes per symptom.

