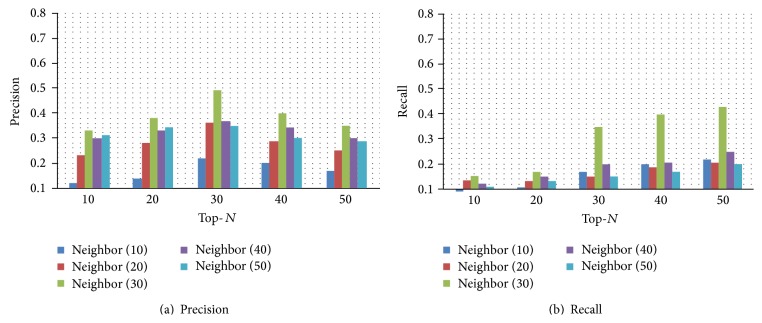
Figure 5.
Selecting the optimal neighborhood size in Infertility Dataset. Here, in (a), the x-axis represents Top-N prediction. The y-axis refers to Precision. In (b), the x-axis represents Top-N prediction. The y-axis refers to Recall. These two figures can be obtained by using PH_Path based strategy, which applies the measurement method AM. In this experiment, we set λ 0, λ 1, and θ as 0.8, 0.2, and 0.5, respectively.

