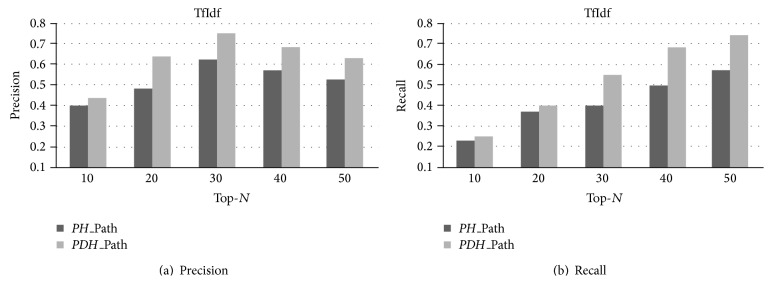
Figure 8.

Prediction performance of our proposed method Tri-TSPA. Here, in (a), the x-axis represents Top-N prediction. The y-axis refers to Precision. In (b), the x-axis represents Top-N prediction. The y-axis refers to recall. Tri-TSPA adopts TfIdf to install the reasonable value to each term for each matrix.
