
Figure 3.
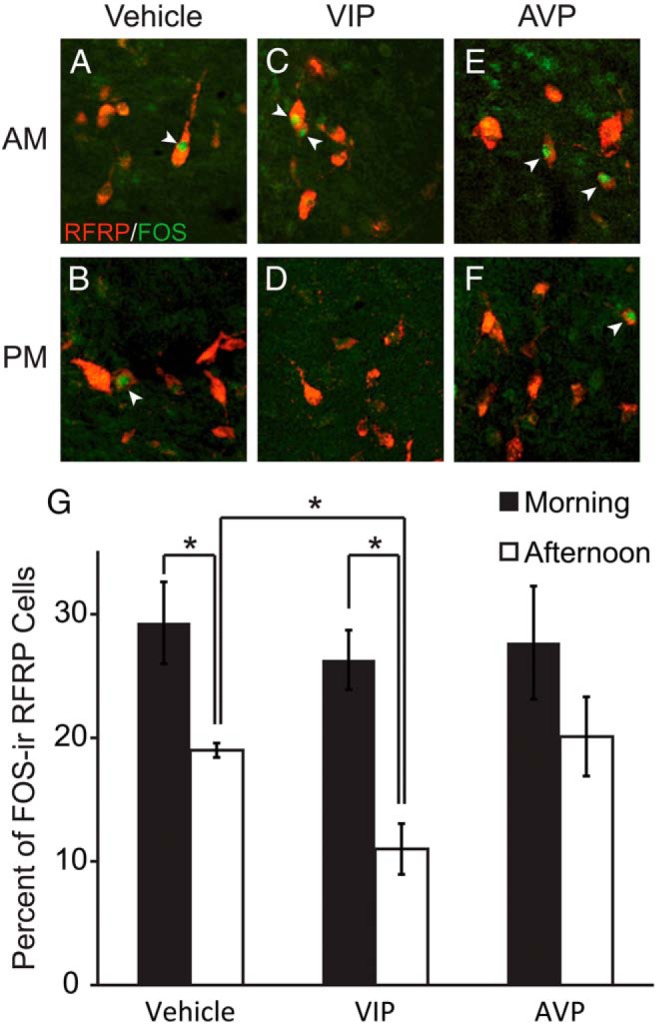
Representative photomicrographs depicting RFRP-3-ir (red) and Fos-ir (green) neurons 1 hour after intracerebroventricular injection of (A) saline (vehicle) at ZT2 (morning) and (B) ZT12 (late afternoon), (C) AVP (morning) and (D) AVP (late afternoon), and (E) VIP (morning) and (F) VIP (late afternoon). G, Mean (±SEM) percentage of RFRP-3 cells expressing Fos after saline (vehicle), AVP, or VIP injections in the morning or late afternoon. *, significantly different (P < .05).