
Figure 5.
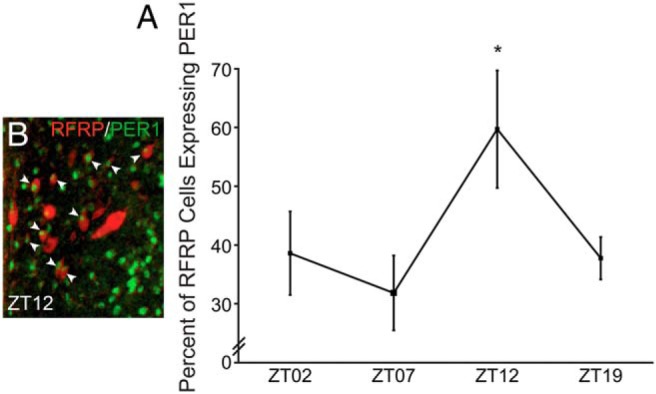
RFRP-3 cells rhythmically express PER1 protein. A, Representative low-power photomicrograph of RFRP-3-ir (red) and PER1 (green) immunofluorescence at ZT12. B, Mean (±SEM) percentage of RFRP-3-ir cells expressing PER1-ir at ZT2, ZT7, ZT12, and ZT19 in ovariectomized estradiol-treated female hamsters. *, significantly greater (P < .05) than ZT7, comparison with ZT2 and ZT19 nearing significance, P = .052 and P = .057, respectively.