Figure 2.

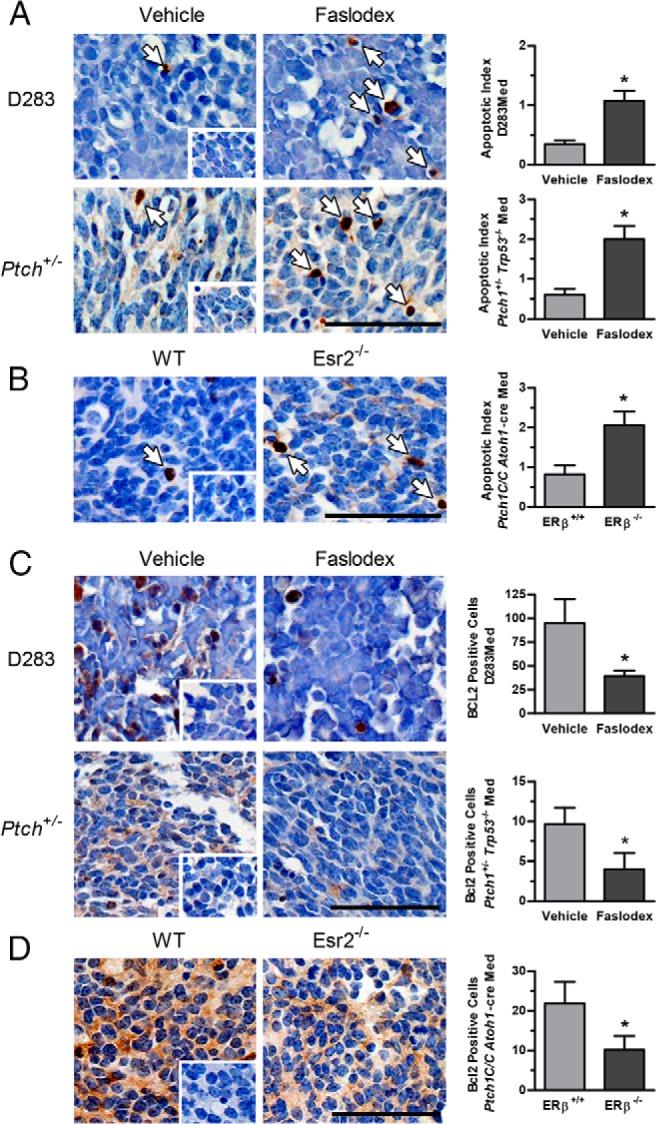
Immunohistochemical analysis of apoptosis and BCL2 expression in medulloblastoma tumors. Shown are representative micrographs of active cleaved caspase-3 immunostaining and the results from quantitative analysis of caspase-3 immunopositive apoptotic cell numbers from D283Med xenografts and Ptch1+/− Trp53−/− tumors from mice treated with vehicle or Faslodex (A) and Esr2+/+ Ptch1C/C Atoh1-cre and Esr−/− Ptch1C/C Atoh1-cre tumors (B). For D283Med xenograft groups, n = 6 for vehicle and n = 5 for Faslodex; Ptch1+/− Trp53−/− n = 5 for vehicle and n = 6 for Faslodex. For Esr2+/+ Ptch1C/C Atoh1-cre, n = 17 and Esr−/− Ptch1C/C Atoh1-cre, n = 10. Caspase-3-positive apoptotic cells are indicated with arrows. Representative micrographs of BCL-2 immunostained D283Med xenografts and Ptch1+/− Trp53−/− tumors from mice treated with vehicle or Faslodex (C) and Esr2+/+ Ptch1C/C Atoh1-cre and Esr−/− Ptch1C/C Atoh1-cre tumors (D) are shown. Quantitative analysis of BCL2-immunopositive cell numbers per 1000 cells counted is shown; for D283Med xenograft groups, vehicle, n = 5, Faslodex, n = 4; Ptch1+/− Trp53−/− vehicle, n = 3, Faslodex, n = 3; Esr2+/+ Ptch1C/C Atoh1-cre n = 6, Esr−/− Ptch1C/C Atoh1-cre, n = 6. Quantitative results are expressed as mean ± SD. Significant differences between mean values for control and experimental groups were determined using a Student's t test. Shown as insets are identically treated control sections from D283Med xenografts, Ptch1+/− Trp53−/− and Esr−/− Ptch1C/C Atoh1-cre tumors stained following incubation with normal serum. Scale bar, 50 μm.
