Figure 1.
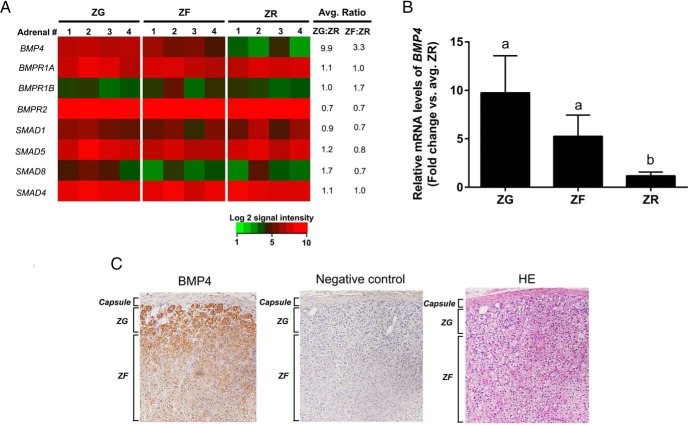
A, Heat map representation of microarray analysis for transcripts encoding genes involved in the BMP signaling pathway in adrenal ZG, ZF, and ZR. Normalized log2 signal intensity acquired from microarray analysis is represented by color (see color bar). Average ratio was calculated as average of normalized ZG or ZF signal intensities divided by that of normalized ZR signal intensities (n = 4) as indicated. A two-fit ANOVA (P < .05) confirmed that BMP4 was higher in the ZG as compared with both ZF and ZR. BMPR1A, BMP type IA receptor; BMPR1B, BMP type IB receptor; BMPR2, BMP type II receptor. B, Quantitative RT-PCR analysis for BMP4 in the adrenal ZG, ZF, and ZR obtained by laser capture microdissection. Validation of microarray analysis by real-time qPCR for BMP4 in ZG vs ZF vs ZR. BMP4 showed higher expression in ZG and ZF as compared with ZR. Three ZG, ZF, and ZR samples were used for qPCR analysis. Data are represented as mean ± SEM. Different letters above the bars indicate statistically significant differences (P < .05) between the zones (n = 4). Statistical significance was determined using a one-way ANOVA followed by a Holm-Sidak test. C, Immunohistochemical localization for BMP4 in the adrenal capsule, ZG, and ZF. Immunohistochemical analysis showed that BMP4 levels (left panel) were highest in ZG. Middle and right panels represent corresponding negative control (rabbit antiserum used instead of primary antibody) and hematoxylin-eosin (HE) stained sections, respectively.

