Figure 6.
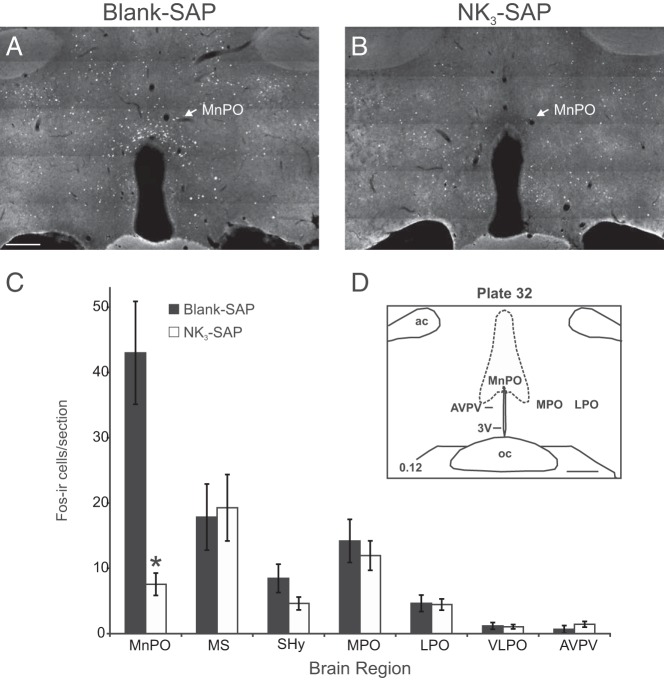
Representative photomicrographs of Fos immunofluorescence in blank-SAP (A) and NK3-SAP (B) rats injected subcutaneously with senktide 90 minutes before killing. After senktide injections, numerous Fos-ir cells were identified in the MnPO of control rats (A) but not in that of NK3-SAP rats (B). C, Average numbers of Fos-ir cells counted in blank-SAP and NK3-SAP rats injected with senktide. In the MnPO, the number of Fos-ir neurons was markedly decreased in NK3-SAP rats, compared with those in controls. No significant differences were detected in other areas. D, Schematic diagram of landmarks at this level of the hypothalamus (43). Scale bar corresponds to 250 μm for A and B. Scale bar corresponds to 500 μm for D. Values represent means ± SEM; n = 8 rats/group. *, P < .05, significantly different, blank-SAP vs NK3-SAP. ac, anterior commissure; AVPV, anteroventral periventricular nucleus; LPO, lateral preoptic area; MnPO, median preoptic nucleus; MPO, medial preoptic area; MS, medial septum; oc, optic chiasm; SHy, septohypothalamic nucleus; VLPO, ventrolateral preoptic area; 3V, third ventricle.

