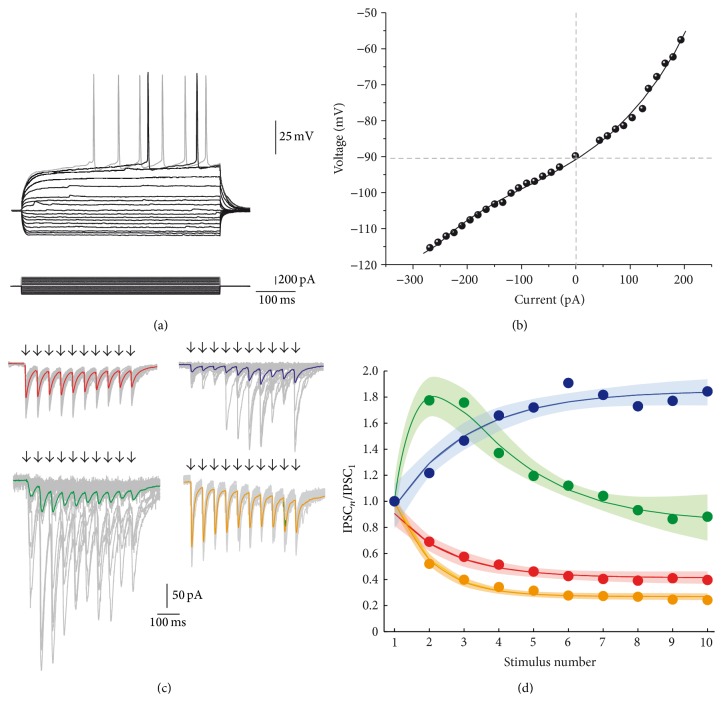
Figure 1.
Different classes of short-term synaptic plasticity from inhibitory synapses that target striatal projection neurons. (a) Recorded neurons are striatal projection neurons or spiny neurons. Top: depolarizing and hyperpolarizing voltage responses. Bottom: intracellular current steps that evoked the voltage responses. (b) Current-voltage relationship (I-V plot) measured from the traces in A. (c) Protocol to evoke short-term synaptic plasticity (STSP): trains of intrastriatal field stimulus at 20 Hz are pointed with arrows. Thick colored traces represent the average of 25 individual responses and thin gray traces represent individual responses showing quantal variation. Trains of inhibitory postsynaptic currents (IPSCs) were evoked equally in all cases but the class of STSP obtained varied: red traces: short-term synaptic depression (STD); blue traces: short-term synaptic facilitation (STF); green traces: short-term biphasic plasticity (STB). For comparison, yellow traces are the response to antidromic field stimulation from the globus pallidus (STD) which mostly represents connections between SPNs (López-Huerta et al., 2013 [28]). Basal current is subtracted to measure each individual IPSC. (d) STSP dynamics of averaged and normalized IPSCs from samples of each class of STSP. Colored circles represent average experimental data. Thick colored lines represent the fit of (1): IPSCn/IPSC1 = (A − e −x/τRec)∗(e −x/τDep + B) + C. The surrounding shadow area denotes estimation error. Note that three classes of STSP are present.

