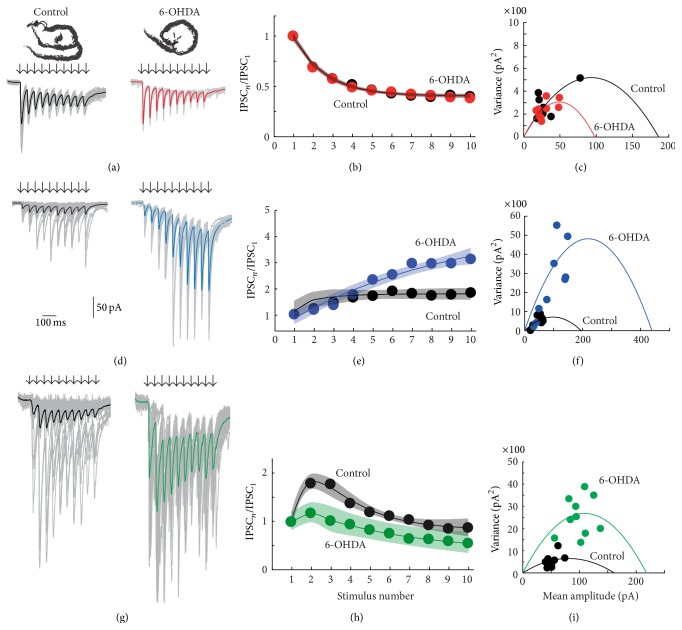
Figure 4.
Synapses of 6-OHDA lesioned animals were affected differentially depending of the type of STSP that they expressed. (a) An STD synapse in control and after dopamine (DA) depletion (red). In these and next recordings, black or colored lines are the average of individual traces shown in grey. (b) Average short-term dynamics of both samples of neurons were similar (almost superimposable). (c) Variance-mean analysis of representative synapse in A. Except for one data point from the control, clouds of red and black dots are superimposable. (d) An STF synapse in control (black) and after DA depletion (blue). (e) Average short-term dynamics of both samples of neurons were different. After DA depletion short-term dynamics show more facilitation (blue) and failures decreased. Mean amplitude was larger. (f) Variance-mean analysis of representative synapse in (d). Control (black) and DA depleted (blue) data points distribute differently. Analysis showed that both probability of release and number of release sites probably increased. (g) An STB synapse in control (black) and after DA depletion (green). (h) Average short-term dynamics of samples of these synapses were different. After DA depletion short-term dynamics show less facilitation (green) and failures decreased. Mean amplitude was larger. (g) Variance-mean analysis of representative synapse in A. Control (black) and DA depleted (green) data points distribute differently. Analysis showed that both probability of release and number of release sites probably increased. Illustrated in Figure 6.

