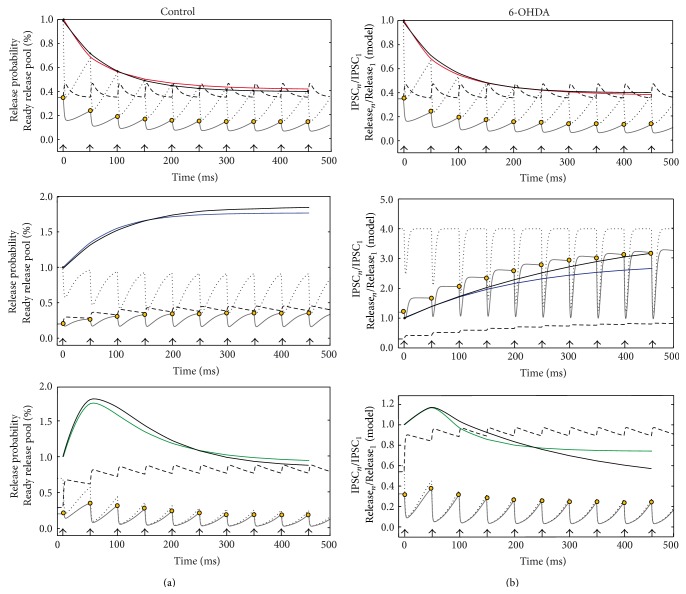
Figure 6.
Reproducing experimental results with the proposed new model of short-term synaptic plasticity (see in Section 2 system of equations (3)). (a) Variables of STSP dynamics as a function of a train of stimulus in control conditions: probability of release (p, dashed trace), occupancy of the readily releasable pool (x, dotted trace). Maximal release (gray trace) after each stimulus is the product x(t)∗p(t). Maximal release (yellow circles) for each pulse was normalized to the initial maximal release x(0)p(0) and plotted in color lines for each synapse (red, blue, and green traces). Experimental traces are in black, to compare with model output (colored). (b) Reproduction of STSP in a 6-OHDA rodent model of Parkinson's disease was less better than the controls; however, it shows the main changes in the release machinery caused by DA depletion (explanation in text).

