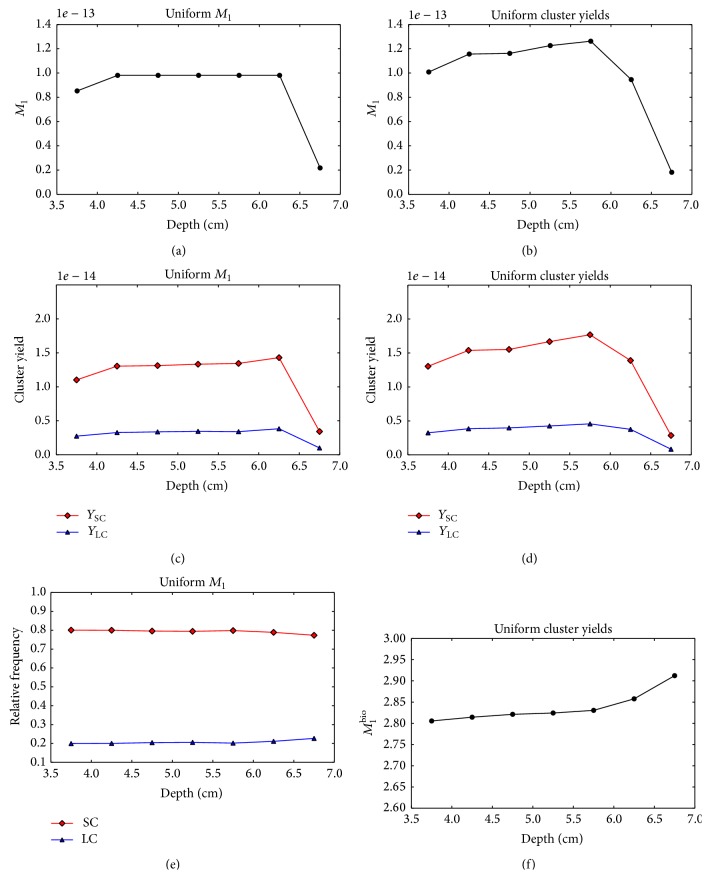
Figure 5.
Nanodsimetric quantities calculated for the optimized single-field proton plans as a function of the voxel depth. Results of the uniform M 1 optimization and uniform cluster yield optimization are shown in the left and right columns, respectively. (a), (b) Composite M 1. (c), (d) Composite Y SC (squares) and Y LC (triangles). (e) Frequency of small clusters Y SC (squares) and large clusters Y LC (triangles) relative to the total yield Y SC + Y LC. (f) Composite M 1 bio.

