
Fig. 7.
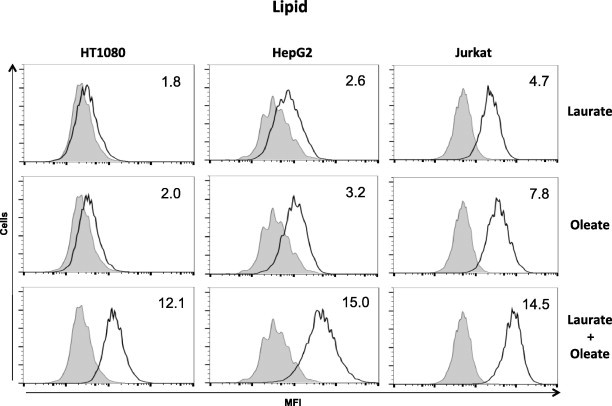
Lipid accumulation following co-addition of laurate and oleate. Cells were stimulated with fatty acids for 6 h and then stained with Nile Red to detect lipid droplets. The histograms show the mean fluorescence intensities (MFIs) of untreated cells (shaded boxes) and stimulated cells (white boxes) with laurate (upper), oleate (middle), or the combination (lower). Each number is the average MFI (in arbitrary units, AUs) compared to that of untreated cells (AU = 1), reflecting lipid droplet accumulation (lipid). The data are representative of at least three separate experiments.