Table 3.
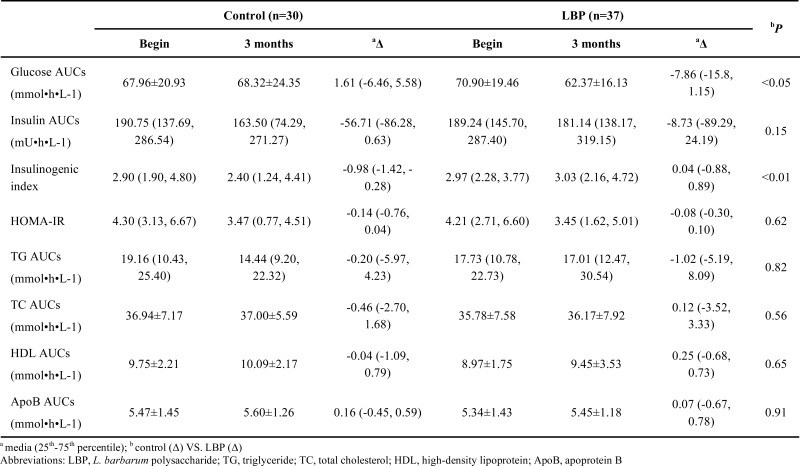
Comparison of areas under the curve (AUCs) of 67 patients with type 2 diabetes for glucose, insulin and lipids after oral metabolic tolerance test.

Comparison of areas under the curve (AUCs) of 67 patients with type 2 diabetes for glucose, insulin and lipids after oral metabolic tolerance test.
