FIGURE 2.

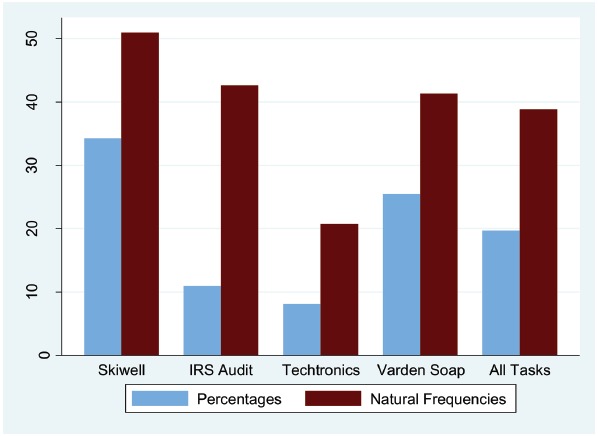
Percentages of Bayesian responses, depending on whether the numerical information has been communicated in terms of percentages or natural frequencies.

Percentages of Bayesian responses, depending on whether the numerical information has been communicated in terms of percentages or natural frequencies.