
Figure 1.
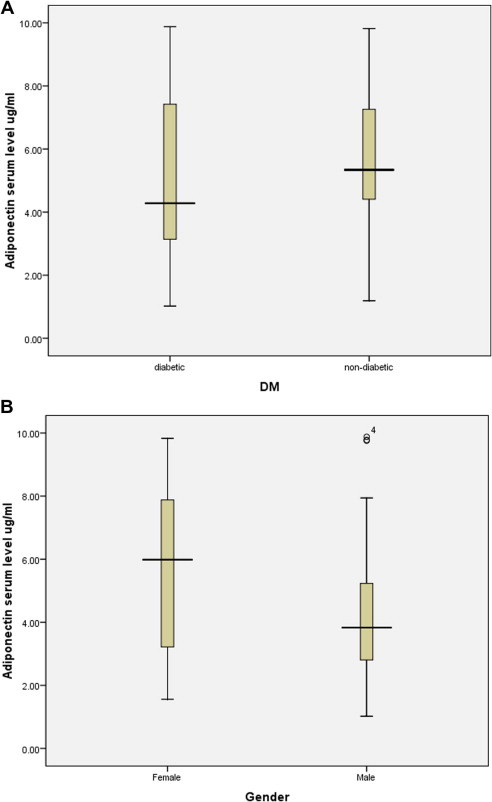
Box and whisker plot plots of adiponectin serum levels in different subject groups. (A) Adiponectin serum levels in diabetic and non-diabetic. (B) Adiponectin serum levels in diabetic females and males.
Official websites use .gov
A
.gov website belongs to an official
government organization in the United States.
Secure .gov websites use HTTPS
A lock (
) or https:// means you've safely
connected to the .gov website. Share sensitive
information only on official, secure websites.
Box and whisker plot plots of adiponectin serum levels in different subject groups. (A) Adiponectin serum levels in diabetic and non-diabetic. (B) Adiponectin serum levels in diabetic females and males.