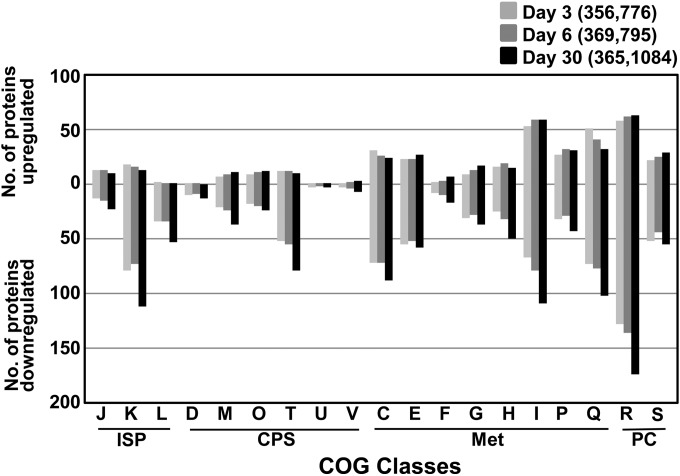
FIG 3.
Comparative analysis of distributions among differently regulated proteins based on COGs as grouped in Fig. S3 in the supplemental material (see Data Sets S3 and S4 in the supplemental material). ISP, information storage and processing; CPS, cellular processes and signaling; Met, metabolism; PC, poorly characterized. COG category descriptions are provided in Table 1.

