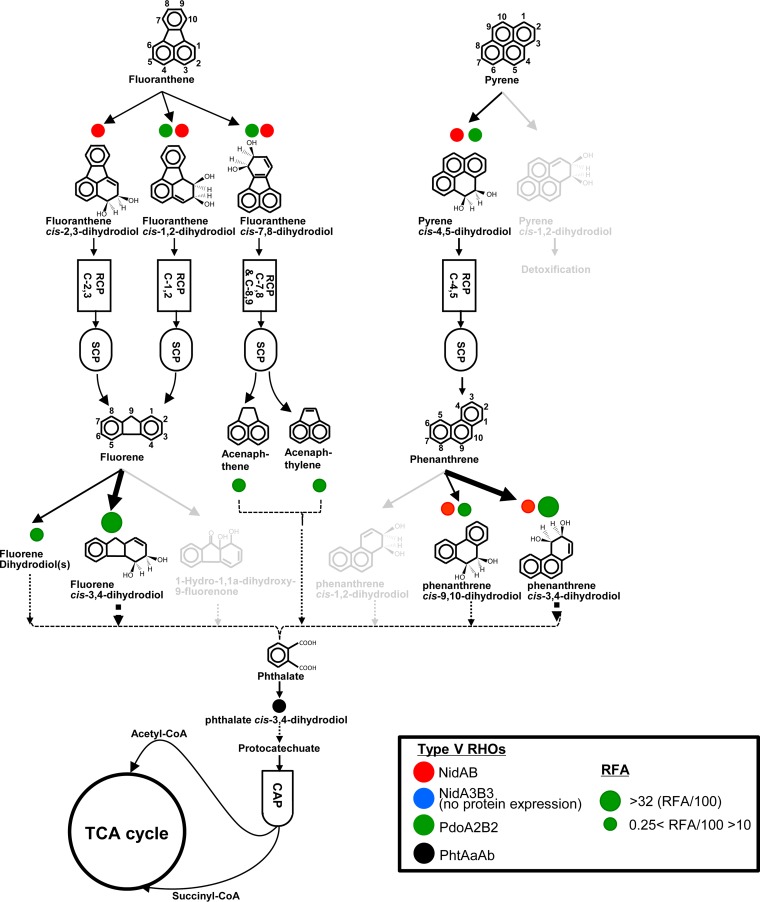
FIG 5.
Functional map of the M. vanbaalenii PYR-1 RHO enzymes for the degradation of BP crude oil phenanthrene, pyrene, and fluoranthene. (The map was adapted from our previous reports [34, 35] with modifications.) The arrows indicate degradation pathways, and differences in transformation efficiency are represented by the thickness of the arrows. The light-gray pathways indicate no activation of degradation routes. Circles with color indicate RHO enzymes, with sizes proportional to the degrees of functional contribution.

