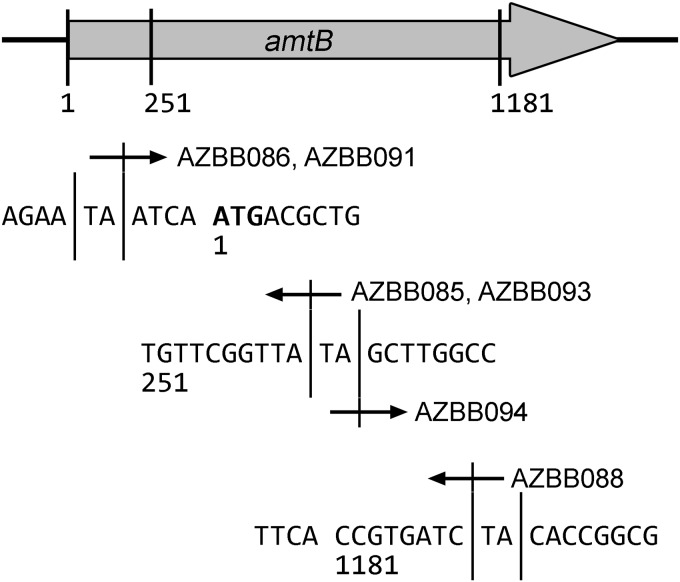
FIG 4.
Insertions into amtB resulting in nitrogen production phenotypes. At the top of the figure is a drawing of the amtB gene region of A. vinelandii. The three different regions where insertions were found in the present study during the nitrogen production screen are marked on the diagram, and the sequence of each region is shown below. Specific TA base regions where insertions were made are marked with dividers on either side, and arrows are included depicting the region that was sequenced immediately outside the transposon inverted repeat when sequenced with a primer that complemented a segment within to the kanamycin selection marker from within the transposon. Specific strain numbers of A. vinelandii from Table 1 are labeled beside each arrow.

