FIG 2.
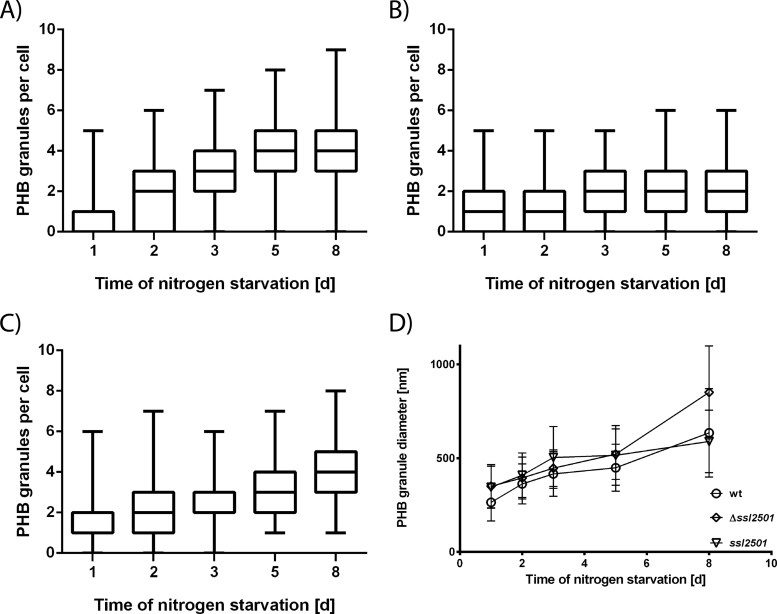
(A to C) Number of PHB granules per cell during nitrogen starvation in the wild type (A), the ssl2501 mutant (B), and the ssl2501 mutant complemented with plasmid pVZ322-2501 (C). Measurements represent the distribution of PHB granules in at least 150 cells at a given point. (D) Mean PHB granule diameter during nitrogen starvation in the wild type (open circles), the ssl2501 mutant (diamonds), and the ssl2501 mutant complemented with plasmid pVZ322-2501(inverted triangles). Difference in PHB granule diameters is statistically significant from day 6 on (P < 0.0001). Each data point represents the mean of at least 170 individual measurements of the PHB granule diameter.

