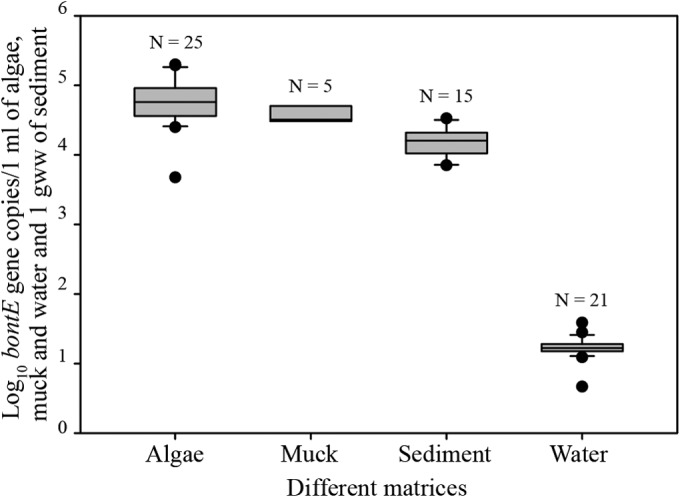
FIG 2.

Distribution of bontE in different matrices: algae (SUB and AlgOn), muck from Bay City, sediment (SED and SOS), and water. The horizontal line in the gray bars shows the median value, the whiskers show the 10th and 90th percentiles, and the black dots show the outliers. The number above each bar indicates the number of samples that were above the LOQ. gww, gram wet weight.
