FIG 2.

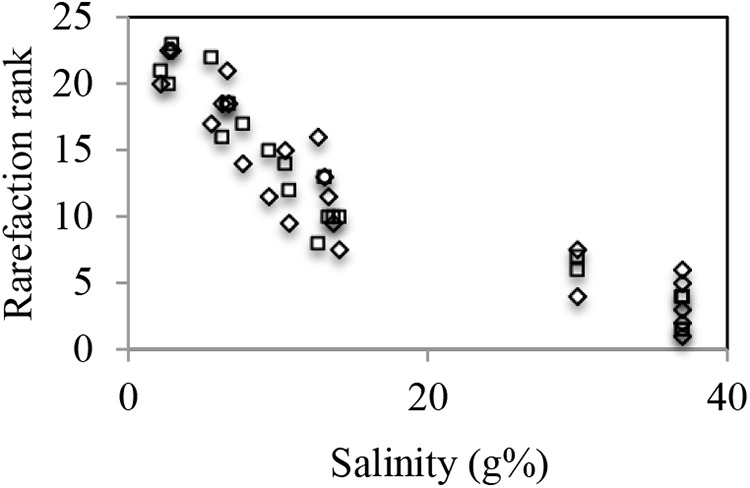
Salinity-diversity relationship. Sample salinity (x axis) was correlated to the diversity ranking of each sample (from 1 [least diverse] to 23 [most diverse]) (y axis), computed at both 97% (□) and 94% (◇) sequence similarity cutoffs.

Salinity-diversity relationship. Sample salinity (x axis) was correlated to the diversity ranking of each sample (from 1 [least diverse] to 23 [most diverse]) (y axis), computed at both 97% (□) and 94% (◇) sequence similarity cutoffs.