
FIG 5.
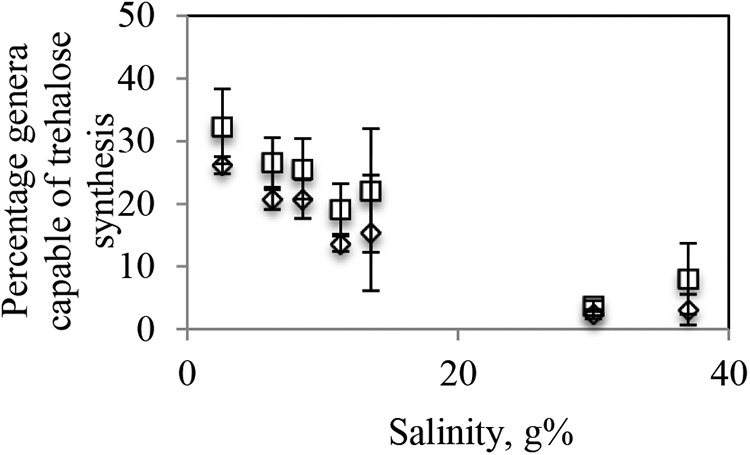
Effect of sample salinity on the total abundance of trehalose-producing genera. The sum of percent abundances of genera possessing an otsAB system determined on the basis of either experimental or genomic evidence (○) or predicted on the basis of phylogenetic affiliations (◇) is plotted on the y axis versus salinity on the x axis. Values shown are averages ± standard deviations for samples within the same salinity range as follows: very low (2% to 3%, 3 samples from 1 site), low (5% to 6.6%, 4 samples from 2 sites), medium-low (7.6% to 9.5%, 2 samples from 2 sites), medium-high (10.5% to 12.7%, 3 samples from 3 sites), high (13% to 14%, 4 samples from 2 sites), very high (30%, 2 samples from 1 site), and saturated (37%, 5 samples from 1 site). Individual sample data are shown in Fig. S3 in the supplemental material.